How the scores are calculated
The AEDC tracks the development of children in Australia over time. Benchmarks were created from the first data collection in 2009 and these national ‘cut-offs’ will stay the same for all future collections.
The AEDC is a population measure. It is not intended to identify individuals or evaluate schools.
Teachers complete around 100 questions about children in their class, covering five domains of early childhood development. Responses are totalled out of 10 for each domain. These scores are compared to the national cut-offs to classify whether children are developmentally on track, at risk or vulnerable on each domain.
- Developmentally on track: Children who score above the cut-off score set at the 25th percentile (top 75 per cent) of the 2009 AEDC population with valid domain scores.
- Developmentally at risk: Children who score between the cut-off scores respectively set at the 10th percentile and 25th percentile of the 2009 AEDC population with valid domain scores.
- Developmentally vulnerable: Children who score below the cut-off score set at the 10th percentile (bottom 10 per cent) of the 2009 AEDC Population with valid domain scores.
Summary indicators
There are three summary indicators that help monitor trends in child development. Two indicators are deficit-based and measure developmental vulnerability across the domains to help identify groups of children who are most vulnerable. The third indicator reflects children’s developmental strengths, to help identify where things are working well to support children’s holistic development:
- Developmentally vulnerable on one or more domains (DV1): The percentage of children who are developmentally vulnerable on one or more AEDC domains.
- Developmentally vulnerable on two or more domains (DV2): The percentage of children who are developmentally vulnerable on two or more AEDC domains.
- Developmentally on track on five domains (OT5): The percentage of children who are developmentally on track on all five domains.

Critical difference and statistical significance
Almost all communities will see a change in AEDC results over the years. The ‘critical difference’ was developed to help understand if those changes are significant.
Critical difference is the minimum level of change, in percentage points, required between any two data collection periods for the results to be significant. Significant, in this case, means a level of certainty that the change did not occur by chance.
The critical difference will change depending on the number of children in the community and the outcome of interest (developmentally vulnerable, at risk or on track on an individual domain, DV1, DV2, or OT5). The critical difference can help when comparing results over time in small communities, where a few additional children who are vulnerable can have a bigger impact on the percentage of children who are vulnerable.
The Critical Difference Calculator Tool is designed to provide communities with some guidance when interpreting local results.
Percentage versus number
It is important to consider the percentage and the number of children in each category. When a community is small, it only takes a change in a few children to have a big impact on the percentage of children who are developmentally vulnerable.
For example, if two communities are compared:
- Community A has 200 children and Community B has 20 children
- Both have 10 per cent of children vulnerable
This equates to 20 vulnerable children in Community A, but only two children in Community B.
If two more vulnerable children are added to both, now Community A has 11 per cent vulnerable children and Community B has 20 per cent.
Tracking progress over time
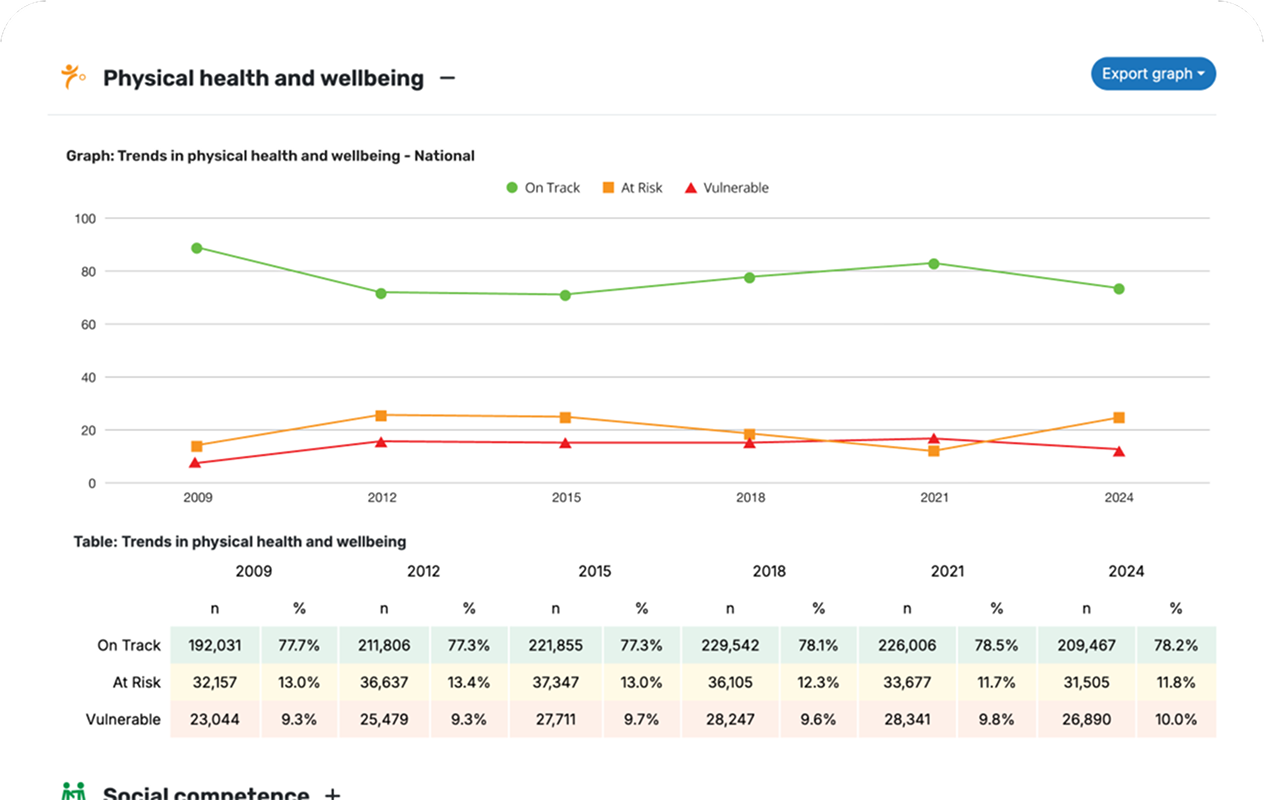
There have now been six AEDC collections. This represents a large dataset that allows for progress to be tracked over time for each domain. For example, if children are faring better on the Physical health and wellbeing domain over time, we would expect to see fewer children classified as developmentally vulnerable and more children classified as on track with each cycle.
Another way to track progress is to look at the summary indicators. For example:
- In 2009, the percentage of children developmentally vulnerable on one or more domain was 23.6 per cent.
- In 2021, this was 22 per cent.
- This means that children’s development improved by 1.6 percentage points between the 2009 and 2021 cohorts.
Resources
There are several resources available to help access, understand and interpret the AEDC results and what they mean for Australia and its communities.
These include:
- Fact sheet: Trends from the AEDC
- Fact sheet: Understanding the AEDC Results
- Fact Sheet: Critical Difference
- How to interpret data
- AEDC User Guides

Community Data Explorer
Navigate the AEDC Community Data Explorer and understand the data.