Each Community Profile contains:
- background information about the AEDC
- information to help understand and interpret the results
- demographics and characteristics of children (such as gender and experiences in early childhood care and education)
- information about how well children are transitioning to school
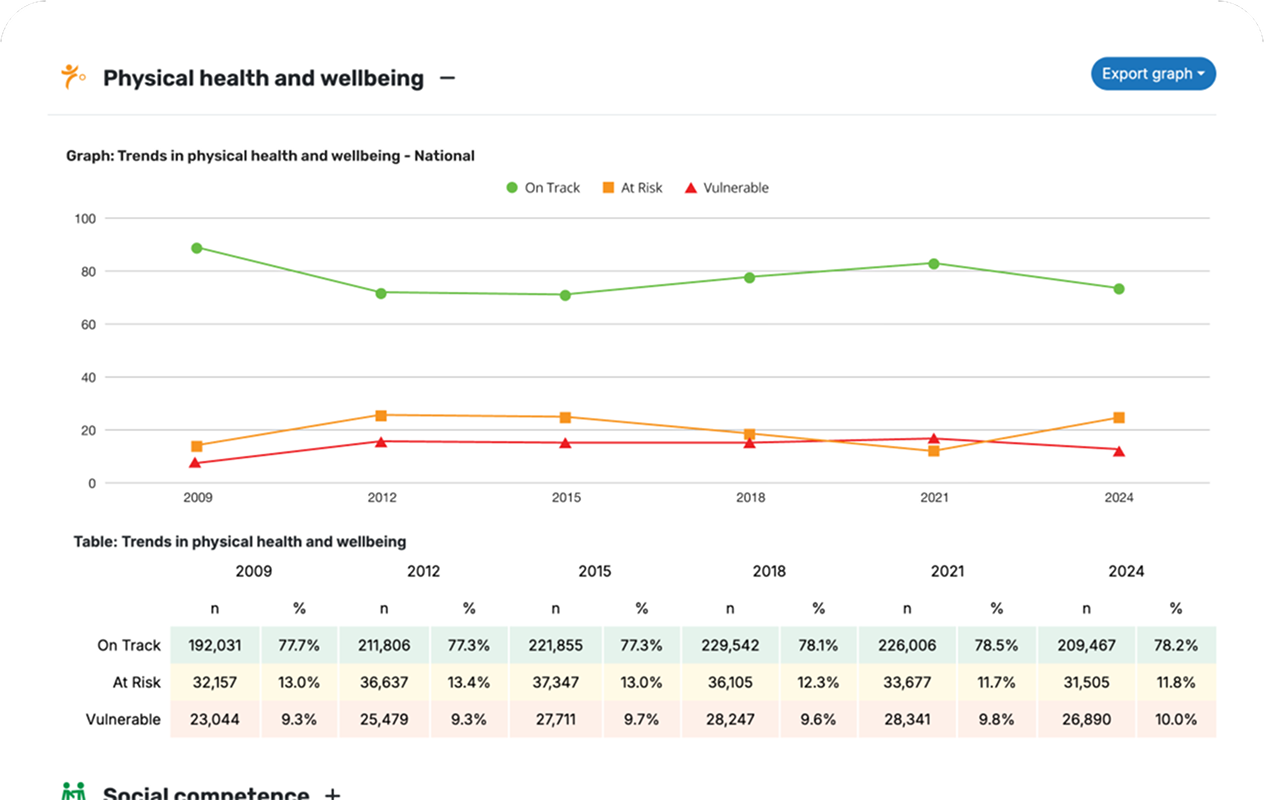
- AEDC domain and summary indicator results over time, including a breakdown by local community
- comparison to state/territory and national results.
Community Profiles can be located using the Community Data Explorer below.
Community Data Explorer
Navigate the AEDC Community Data Explorer and understand the data.